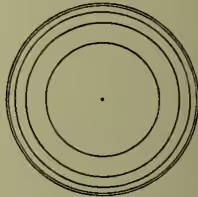
Contour. When, on a map of any district or country, a line is drawn through points on the earth's surface which are all at the same height above mean sea-level, the curve so obtained is termed a contour-line. For equidistant altitudes a series of such lines may be drawn. It is obvious that they may be ideally laid down by projecting orthographically on the map the sections of the earth's surface made by a series of horizontal planes at equal distances apart; or (what is the same thing) were the sea-level to rise 100 feet, then to 200 feet, and so on, above its normal level, the sea-margins made at each successive rise would be the contour lines of the district for 100 feet, 200 feet, &c. These lines, which are drawn on British Ordnance Survey maps for intervals of usually 50 feet, however they may vary in form in different cases, have certain common properties which render them of assistance to the surveyor, engineer, and geographer. Suppose, for example, the case of a hemispherical hill be taken (see fig.), and that the contours (which are, in this case, concentric circles) are drawn for each 100 feet of altitude. It will be noticed that where the shortest distance between two successive contours is least, there the hill is steepest; for, in ascending the hill at that part, a given length inwards horizontally is accompanied by the greatest vertical ascent. In other words, the steepness of slope or gradient at any point in any given direction is inversely as the distance between the contours at that point in the given direction. The line of steepest slope at any point is therefore the shortest line which can be drawn to the next contour which it cuts at right angles. This is the course which would be taken by water running down the hillside, and hence is termed a stream-line. Thus in any given system of contour-lines the corresponding system of stream-lines can be obtained by drawing a system of orthogonal curves.
The method of contours has found many applications in science besides the one already detailed. Especially in meteorology has it been of service; here isothermals and isobars drawn on a map are simply lines drawn through points having the same temperature and barometric pressure respectively; the corresponding stream-lines being lines of flow of heat or of atmospheric pressure. Similarly, lines of equal magnetic dip, variation, and intensity are examples of applications in terrestrial magnetism.
The method is also applicable to other dimensions in space than those we have dealt with. The contours of a curve are points; of a surface (exemplified above), curves; while those of a solid are surfaces. From the examples given it may be seen that a contour is a point, line, or surface at, along, or on which some physical property or characteristic is constant. Generally the advantage of the method is that by its means the mutual variations of three quantities may be represented by lines in two dimensions.