Magnetism, TERRESTRIAL. Under the general article MAGNETISM the broad fact that the earth is a magnet has been incidentally touched upon. In this article we propose to consider in more detail the magnetic features of the earth as a whole. In studying the magnetic field associated with the earth we are confined to its surface, and are unable to trace the lines of force throughout their whole length. We believe, however, that these lines of force have the properties of all lines of force associated with magnets. In general they pass by continuously curved paths from regions in the southern hemisphere to regions in the northern hemisphere. The southern hemisphere, therefore, is the seat of what is called northern or positive magnetism.
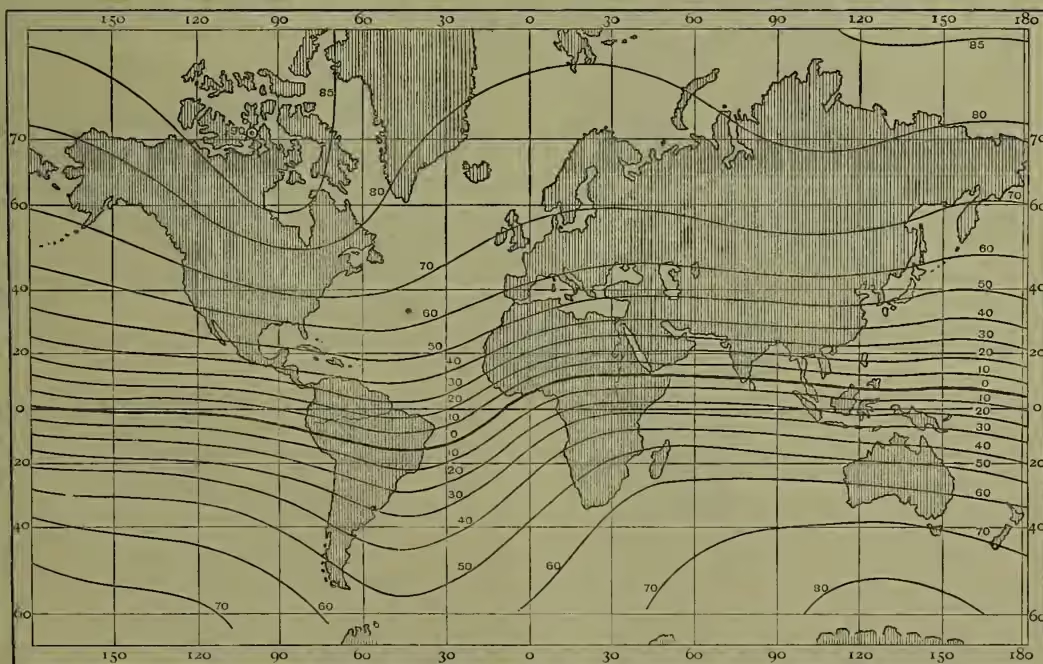
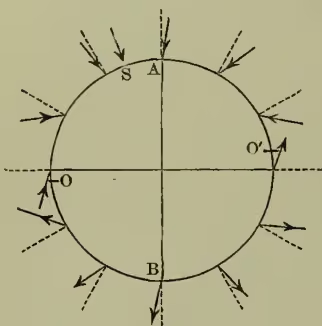
The direction of the line of force at any point is given by the direction in which a perfectly free magnet placed there will point (see MAGNETISM). To obtain the direction of the earth's magnetic force we must suspend the magnet accurately by its centre of mass, as in the apparatus known as the Dipping-needle (q.v.). With such an apparatus, let us, beginning at the extreme south point of Africa, move northwards and study at each successive stage the behaviour of the magnet. At first it will be found to make an angle of about with the horizontal, pointing upwards towards the north-west. This angle of is called the dip, and will steadily diminish as we pass northwards, until, a little to the south-east of Lake Chad, the magnet will be found to rest perfectly horizontal. Proceeding still northwards, we shall find the magnet beginning to tilt again, but this time with the north-pointing end downwards. As we leave the north coast of Africa in E. long. the dip will be nearly ; it will be as we enter Turkey, gradually increasing to nearly as we leave the north coast of Norway. Very similar changes in dip will occur as we pass along any longitude line. The general features are shown in fig. 1, reduced from Nenmayer's chart for 1885, as given in the new edition of Berghaus' Physikalischer Atlas. Each line is drawn through all places at which the dip has the value indicated by the number attached. The only points requiring particular remark are the position of the line of zero dip, and the position of the point of maximum dip. The line of zero dip is called the magnetic equator. Its non-coincidence with the geographical equator indicates a marked departure of the earth's magnetic condition from the magnetic condition of a uniformly magnetised sphere, whose magnetic axis coincides with the polar axis. The position of maximum dip shown is where the needle points vertical with its north end downwards. It is called the magnetic north pole, and is situated in the north of Canada in W. long., and N. lat. There is also a magnetic south pole, which is believed to lie somewhere near E. long. and S. lat. The magnetic poles do not, therefore, lie exactly at the extremities of a diameter. It should be noted that the dip is the angle between the line of force at a given locality and the horizontal plane there; that is, the dips in different latitudes are referred to different planes. Fig. 2, which represents the section of the earth along the great circle passing through the geographical and magnetic north poles, will serve to indicate the approximately relative positions of the lines of force. The directions of these at latitudes , , and are indicated by arrows, the dotted lines giving the directions of the true vertical at the various points. AB is the geographical polar axis, S the 'magnetic north pole'—really analogous to the so-called south pole of a magnet.
OO' are the points of zero dip, where the lines of force will be roughly parallel to the magnetic axis.
Returning again to the southern extremity of Africa, let us consider more fully the position of the magnet hanging freely by its centre of mass. To fix this position we require to know not only the dip but also the geographical lie of the vertical plane in which the magnet hangs. This is given by the Declination (q.v.), which may be defined as the angle between the meridian plane and the vertical plane parallel to the magnetic axis of the free-hanging magnet. Practically this angle is determined by a magnet suspended or pivoted so as to lie horizontally, and is what every mariner's compass gives more or less accurately. Near Cape-town the declination is fully west of north (NNWW.); but as we pass northwards it gradually diminishes, until on the Mediterranean shore in long. it becomes only west of north (NW.). Passing farther north we find it still diminishing, but more slowly, until finally, as we leave the north coast of Norway in the same longitude, it is found to be (NW.). The general features of the declination are shown in fig. 3. Each isogone or line of equal declination passes through localities at which the declination had the value as marked in 1885. This figure is also reduced from Neumayer's chart. It will be seen at a glance that the surface of the globe is divided broadly into two regions, separated by the agonic lines (marked thick) or lines of no declination. The one region, including the Atlantic with the whole of Africa and a large part of the Indian Ocean, is characterised by a westerly declination; and the other (with an interesting exception) an easterly declination. These are indicated by arrow-heads appropriately directed.
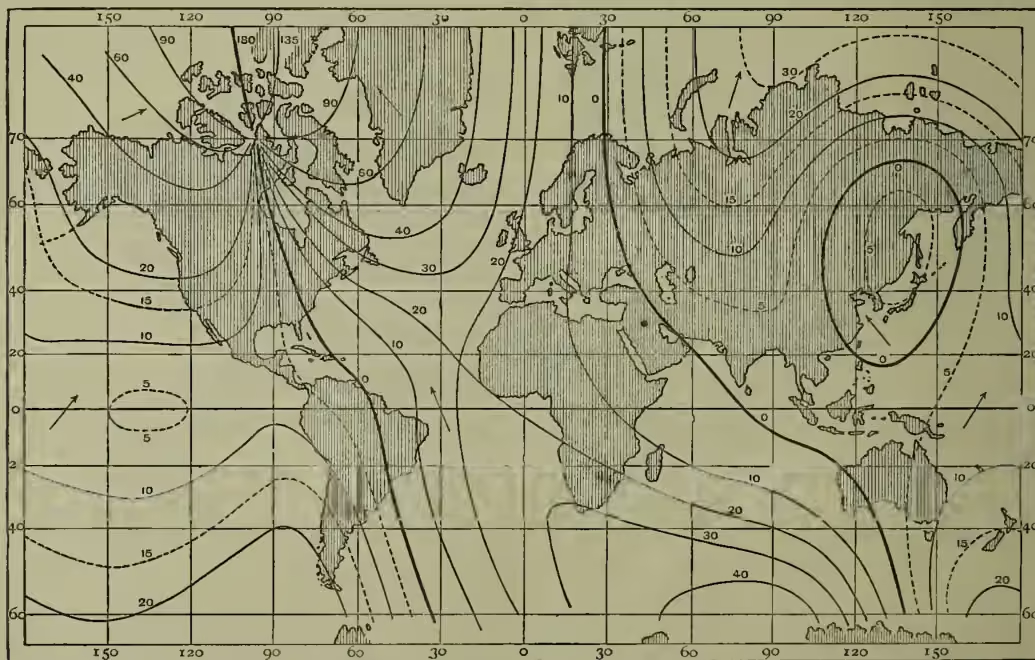
The western boundary of the region of westerly declination passes through the magnetic north pole. This line passes through the localities where the magnet points true geographical north. It continues itself northwards towards the geographical pole as the isogone of , since any magnet, set between the magnetic pole and the geo- graphical pole, will turn its marked end towards the south instead of towards the north. The eastern boundary of westerly declination passes northwards from Europe till, at the geographical north pole, it meets the short isogone of just mentioned. After its south-easterly sweep across the Indian Ocean this line of zero declination passes through the western portion of Australia and finally ends at the 'magnetic south pole.' Continuing as the isogone of till it reaches the geographical south pole, it joins with the other boundary line of zero declination. It will be readily seen that the region of western declination is more contracted than the other; but, as if to balance this, there is an isolated region of western declination situated in the midst of the region of eastern declination. This isolated region lies on the east of Asia, and is enclosed in an oval-shaped agonic line (marked with a thick line in the chart). Declination charts for all seas and shores are invaluable to the practical navigator, by whom they are called variation charts. From them he learns at a glance in what direction the magnetic needle points at the place he happens to be in, and can steer his desired course accordingly. For example, in a voyage from England to India by way of Suez, the western declination diminishes rapidly from at Gibraltar to at Suez. Before India is sighted the agonic line is crossed, and the declination becomes slightly easterly. Thereafter, on as far as Hong-kong or Torres Strait, the compass points never so much as half a point to the east of north. Hong-kong is just outside the small isolated region of westerly declination, through which the route to Vancouver passes. As Vancouver is approached, however, the easterly declination rapidly increases to nearly .
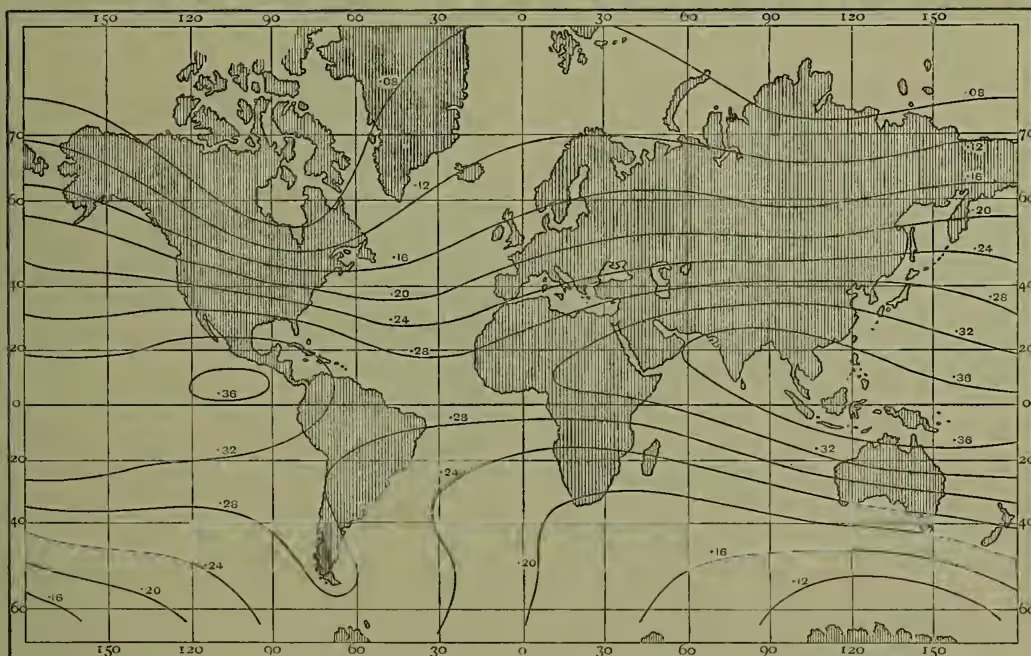
The declination and dip completely determine the direction of the line of force. Its strength or intensity still requires to be known before the magnetic conditions are completely fixed. The total force we may imagine to be determined by measuring the time of oscillation of a dipping-needle of known magnetic moment. Practically, however, it is easier and much more accurate to measure the horizontal component of the total force or intensity of the field. It is consequently more useful to construct a chart showing lines of equal 'Horizontal Force.' Such a chart is shown in fig. 4 (also from Neumayer's chart), each line being drawn through localities at which the horizontal force has the value as marked. The horizontal force must, of course, vanish at the magnetic poles, which we originally defined as the regions where the dip was . From figs. 1 and 4 taken together we may calculate roughly the total magnetic force at any locality, by multiplying the horizontal component by the secant of the angle of dip. Thus, for Edinburgh we have, roughly, ; in Hudson Bay, ; in Central Africa, where the magnetic equator cuts the longitude line, . The total force, therefore, increases in a general way as we approach the magnetic poles. Its maximum values, however, are not exactly at these poles, nor do the positions of minimum value lie on the line of dip.
The declination, dip, and horizontal force are commonly called the magnetic elements. They are all subject to variations in time, so that magnetic charts for one epoch will differ somewhat from those for another epoch. For example, comparing the isogonic lines given in fig. 3 with the isogonic lines for 1840, we see that both the long agonic lines have, for the greater part of their lengths, moved westwards, and the agonic oval has changed form slightly and moved a little eastwards. A line drawn from Nova Scotia to the Cape of Good Hope divides the Atlantic into two regions. In the north-eastern region the declination has been diminishing during the last twenty years, while in the south-western the declination has been increasing. There is some evidence of a periodic variation extending over several centuries. Thus, in 1600 the agonic passed to the west of England and through the Cape of Good Hope, the declination in England being about east of north. In 1700 the westerly declination in England had become or , and that at the Cape about . In 1800 the declinations had increased to or at the two places. All this indicates an eastward motion of the line of zero declination. Since 1818 the westerly declination in England and in western Europe generally has been slowly diminishing, showing that the agonic line had ceased its easterly and begun its present westerly drift. In the charts published by the United States Coast and Geodetic Survey very full information is given regarding the westerly drift of the agonic line that passes through America. South of the Great Lakes its average rate of progress during the last forty years has been nearly five miles per annum. In 1890 the annual change of declination at places in the neighbourhood of the agonic line was about three minutes of arc, westerly increase. At Greenwich the present annual change is about seven minutes of arc, westerly decrease. The secular changes in the dip and horizontal force are very slight, and generally take place in opposite directions, so that the change in the total intensity is still smaller.
The solar diurnal variation of the magnetic elements, and especially of the declination, is the most easily recognised of all the periodic variations to which the earth's magnetism is subject. In all but tropical regions the declination needle oscillates markedly about its mean position for the day, attaining its maximum deviation from one to two hours after noon. In the northern hemisphere this maximum deviation is to the west of the mean position; in the southern hemisphere it is to the east. Again, the total range of variation is greater in the summer months than in the winter months. By an elegant development of Gauss's flawless theory of terrestrial magnetism Schuster has shown that the features of the solar diurnal variations of the different magnetic elements indicate causes above the earth's surface as the source of these variations. This accords with Balfour Stewart's hypothesis that the diurnal magnetic changes result from electric currents in the higher regions of the atmosphere. These currents are due to the action of the sun, and are probably associated with the currents of hot air which pass from the equatorial regions both northwards and southwards. That such electric currents do really exist is demonstrated by the existence of the aurora in higher latitudes; for this phenomenon is beyond question electrical. Further, distinct connection has been traced between auroral displays and magnetic disturbances of exceptional character (see AURORA BOREALIS). These irregular magnetic disturbances or magnetic storms, as they are called, are more frequent and more pronounced at times of maximum sun-spots; and, according to Loomis, a great magnetic storm is always accompanied by an unusual disturbance on the sun's surface. Again, there is no doubt some connection between certain types of magnetic changes and earth-currents, the latter being particularly strong during magnetic storms; but it is now admitted by all authorities that earth-currents cannot be regarded as an efficient cause of the magnetic disturbances.
In addition to the well-marked solar-diurnal variation of the magnetic elements, there is also a lunar-diurnal variation, which has been specially studied by Bronn and Chambers. These and other phenomena of terrestrial magnetism show that the earth is magnetically sensitive to cosmic influences. These influences may be directly magnetic; or, as is more probable in the case of the solar-diurnal variations, they may give rise to meteorological changes involving electric and magnetic actions. As to the ultimate origin of the earth's magnetism as a whole it is not possible, in the present state of the science, to formulate any satisfactory hypothesis. The rotation of the earth, which is so important a factor in the broad meteorological features that exist over the earth's surface, is the only dynamic polarity that can be compared to the magnetic polarity. According to the nebular hypothesis the earth's rotation is a part of a grand circulatory motion of the solar system. So may the earth's magnetism be a part of the general magnetic conditions of the same system. If such a view is too vague for acceptance, the only hypothesis which seems to meet the case is that suggested by Balfour Stewart, who traces the magnetic condition of the earth to the terrestrial meteorological system, as modified by the earth's rotation, acting cumulatively through the ages.