Map (Lat. mappa, 'a towel'). A map is a delineation on a plane of the surface of the earth or of a portion thereof, exhibiting the lines of latitude and longitude, &c., and the forms and relative positions of the countries, mountain-ranges, rivers, towns, &c.; or it may be of the starry heavens, or of stars and constellations. As it is manifestly impossible correctly to represent a spherical upon a plane surface, geographers are consequently necessitated to resort to expedients in order to minimise or distribute the unavoidable distortion and disproportion. Hence the use of the various map projections or arrangements of the lines of latitude and longitude. The only true representation of the earth's surface, it is clear, is to be found on the terrestrial globe. This is inconvenient in form and necessarily too small in scale to serve the purposes effected by maps proper, which are usually produced on paper or other convenient plane surfaces, and a series of which, conjoined, form an atlas. A hydrographical map, specially representing oceans, seas, or navigable waters with their coasts, sandbanks, currents, lighthouses, depths, and other objects and information of importance to seamen, is usually constructed on Mercator's projection, and is called a Chart (q.v.). A special topographical map represents the details minutely and on a considerable scale. The Ordnance Survey of Great Britain and Ireland is a good example of such, and is produced on various scales—viz. 6 inches and 1 inch to a mile respectively. Some counties are also published on a scale of 1 square inch to an acre. Similar products, the result of exact trigonometrical work, are extant of the continent of Europe from the Bay of Biscay to the Lower Volga, and from Sicily to St Petersburg. Portugal also is thus represented, and considerable parts of Sweden and Norway, but not of Turkey or Greece, and but little of Spain. Similarly advantaged are considerable portions of the United States, Algeria, the Nile Delta, Sinai, Palestine, India, Ceylon, and Java. The results of general but not detailed survey exist of the remaining portions of Europe, United States, Canada, Argentina, Cape Colony, eastern and southern Australia, New Zealand, Japan, China proper, and parts of central Asia, Persia, and Asia Minor. Much of the cartography of the rest of the known world is compiled from numerous observations and itineraries, and is fairly reliable. Extensive tracts of North and South America, north Asia, Australia, and most of Africa are only approximately correct. Maps are also constructed for special purposes, and are distinguished as physical, political, military, statistical, historical, &c.
Within the last half-century great improvement has been made in the art of map production or cartography, resulting in great clearness and the combination of a mass of information with artistic beauty. This is attained in some cases partly by the use of conventional signs or arrangements, such as the adoption of blue colour for coasts and watercourses, brown for mountain-ranges, and various tintings for the divisions, political or otherwise, and to distinguish the various natures of the surface, such as forest, arable, prairie, desert, elevation, &c. The art of lithography has been an invaluable aid in all such cases. In Germany especially has this science-art been carried to the greatest perfection.
The scale or definite relation of a map to the actual size of nature is indicated by a graduated line, showing by its divisions the number of miles or yards corresponding to any space measured on the map. In comparing various maps by their scales, it is convenient to refer to the scale of nature, frequently indicated in proportional figures, thus—1 : 3,700,000 ; 1 : 500,000, &c.
The lines of projection on a map are essential for determining the positions of the parts, and indicate latitude, or distance north or south from the equator, and longitude, or distance east or west from any given line. These lines are called meridians, and are usually numbered from the meridian of Greenwich on English maps, and indeed on nearly all maps. Other first meridians in common use are those of Paris, Washington, and Ferro (see LATITUDE AND LONGITUDE). These distances are given in degrees, minutes, and seconds, as in other circle measurements. In choosing a projection, regard must be had to the purpose for which it is intended, and to the area to be represented. The errors inherent in a projection nearly imperceptible in a map of England might be fatal to its use in a map of Asia. In a map of the world equivalence of area is of less importance than freedom from distortion and correctness of relative position. There have been numerous forms of projection devised, including perspectives and approximative developments. Of these only the more familiar can be described here.
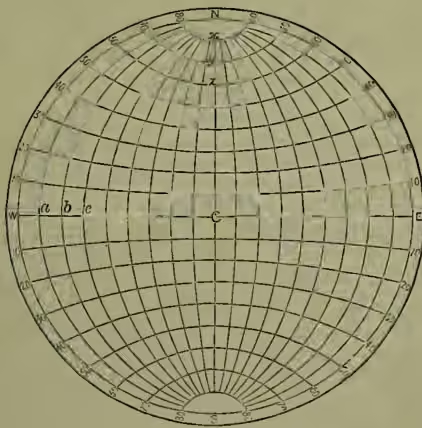
Globular, or Equidistant Projection of a Hemisphere.
The plane on which the perspective map is drawn is supposed to pass through the centre of the earth, and, according to the distance of the eye, the projection is either of the first, second, or third of the following. (1) In the orthographic the eye is assumed to be at an infinite distance from the centre of the earth, so that all rays of light proceeding from every point in its surface are parallel and perpendicular. From the nature of this projection, it is evident that, while the central parts of the hemisphere are fairly accurately represented, the parts towards the circumference are crowded together and diminished in size. On this account it is of little use for geographical purposes, but most suitable for maps of the moon. (2) In the stereographic the eye or point of projection is assumed to be placed on the surface of the sphere opposite the one to be delineated. If the globe were transparent, the eye would then see the opposite concave surface. Contrary to the orthographic, this method contracts the centre of the map, and enlarges it towards the circumference. Owing to the unequal area of the divisions, and the difficulty of finding the true latitude and longitude of places, this projection is not much employed. (3) In order to rectify the opposite effects of the two preceding, the globular projection, a modification of the two, is generally adopted. If we suppose the eye to be removed from the surface to a distance equal to the sine of of the circumscribing circle, the projection is called globular. In other words, if the diameter of the sphere be 200 parts, it must be produced 70 of these parts in order to give the point of projection. All meridians and parallels in this projection are in reality elliptical curves; but as they approach so nearly to circular arcs, they are very rarely shown otherwise.
The construction of the globular or equidistant projection is as follows (fig. 1): Describe a circle, NESW, to represent a meridian, and draw two diameters, NCS and WCE, perpendicular to each other, the one for a central meridian, the other for the equator. Then N and S will represent the north and south poles. Divide each of the quadrants into nine equal parts, and each of the radii, CN, CE, CS, and CW, also into nine equal parts. Produce NS both ways, and find on it the centres of circles which will pass through the three points , , &c., and these arcs described on both sides of the equator will be the parallels of latitude. In like manner, find on WE produced the centres of circles which must pass through , , &c., and the poles. Having selected the first meridian, number the others successively to the east and west of it. A map may in this way be constructed on the rational horizon of any place.
The impossibility of getting a satisfactory representation of special parts of the sphere by any of the previous methods leads to the desire for others less defective. Of all solid bodies whose surfaces can be accurately developed or rolled out upon a plane without alteration, the cone and cylinder approach nearest to the character of the sphere. A portion of the sphere between two parallels not far distant from each other corresponds very nearly to a like conical zone; whence it is that conical developments make the best projections for limited portions of the earth's surface, and even with some modifications for more extensive portions.
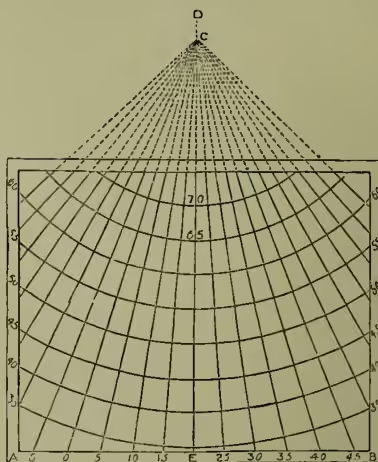
A conical projection of Europe (fig. 2) is constructed thus: Draw a base-line, AB; bisect it in E, and at that point erect a perpendicular, ED, to form the central meridian of the map. Take a space for of latitude, and, since Europe lies between the 35th and 75th parallels of latitude, mark off eight of these spaces along ED for the points through which the parallels must pass. The centre from which to describe the parallels will be the point in ED where the top of a cone, cutting the globe at the 45th and 65th parallels, would meet the axis of the sphere. This point will be found to be beyond the North Pole at C. On the parallels of and , where the cone cuts the sphere, mark off equivalents to of longitude, in proportion to the degrees of latitude in those parallels, and if straight lines be drawn through these points from C they will represent the meridians for every . A modification of the conic projection, suitable for more extensive portions of the sphere, such as of Asia, is obtained by giving on each parallel of latitude the true meridional proportional distances, which results in a curving of the meridian lines outward from the centre of the map.
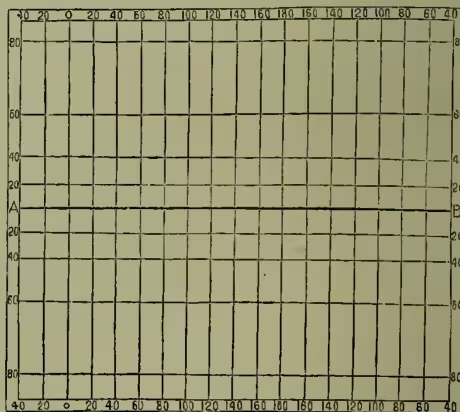
In all the projections hitherto described the direction either of the north and south, or of the east and west, is represented by a curved line, so that on such a map the course of a vessel would almost always be laid down in a curve, which could only be described by continually laying off from the meridian a line at an angle equal to that made with the meridian by the point of the compass at which the ship was sailing. If the vessel were to steer in a direct north-east course by one of the previous projections, she would, if land did not intervene, describe a spiral. The mariner, however, requires a chart which will enable him to steer his course by compass in straight lines only. This valuable instrument is supplied by Mercator's chart, a cylindrical projection in which all the meridians are straight lines perpendicular to the equator, and all the parallels straight lines parallel to the equator. It is constructed thus (fig. 3): A line, AB, is drawn of the required length for the equator. This line is divided into 36, 24, or 18 equal parts, for meridians at , , or apart, and the meridians are then drawn through these perpendicular to AB. From a table of meridional parts (a table of the number of minutes of a degree of longitude at the equator comprised between that and every parallel of latitude up to ) take the distances of the parallels, tropics, and arctic circles from the equator, and mark them off to north and south of it. Join these points, and the projection is made.
This projection, of course, does not give a natural representation of the earth, its effect being to exaggerate the polar regions immensely. The distortion in the form of countries and relative direction of places is rectified by the degrees of latitude being made to increase proportionally to those of longitude. There are other cylindrical projections of the sphere, but this is the most generally valuable and best known. It gives an unbroken view of the earth's surface with the exception of the poles, which are infinitely remote.
Historical.—The ancient Greeks considered Anaximander (560 B.C.) as the inventor of cartography; but there is evidence that about 1000 years earlier some attempts in that direction had been made amongst the Egyptians. Necessarily these efforts were of the crudest, and were made upon the supposition that the earth was a plane. After Aristotle the spherical theory was adopted, and the application of astronomical observations to geography was first made by Pytheas of Massilia (326 B.C.), and the first attempts at projections by Dicaearchus of Messana (310 B.C.). Ptolemy's (150 A.D.) rational teaching had an ultimate valuable influence in the treatment of cartography, although the Romans made little progress in the art, which during the middle ages also showed almost no advance. In the 14th and 15th centuries a gratifying improvement is observable in Italian nautical charts. In the 15th century the revivals of Ptolemy's teaching produced a revolution in the construction of maps, and laid the foundation of modern cartography. There was great increase in the number and importance of maps. The first attempts to improve and increase the methods of projection known to the Greeks were made by Germans, viz. Johann Stöffler (1452-1536), and Peter Apianus (1495-1552), &c. In the same period that Mercator (Gerhard Kremer, 1512-1594) made his invaluable contributions, the Italians,
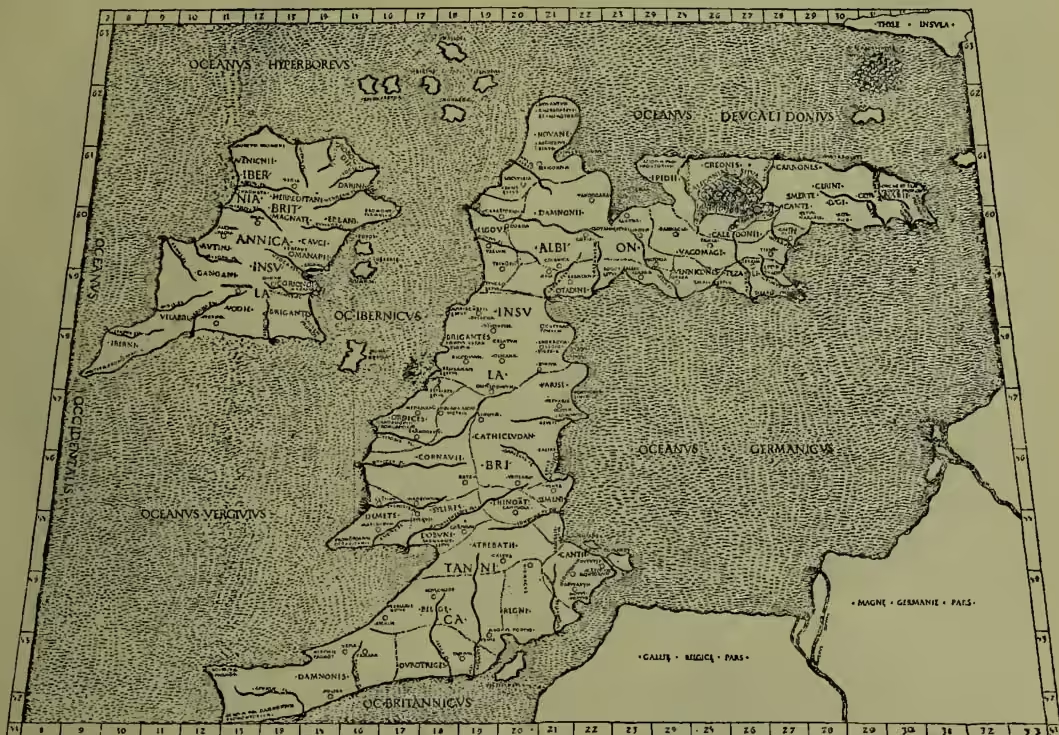
Germans, and Dutch were active competitors in geographical work. Amongst the increasing host of names connected with the subject are found that of Sebastian Cabot (1544), who produced his map of the world. In Germany, Johann Baptist Homann (1644-1724) and Tobias Mayer (1723-86) occur; in France, Nicolas Sanson (1600-67), Guillaume de l'Isle (1675-1726), and Jean Baptiste Bouguignon d'Anville (1697-1782); and in Italy, P. Vincent Cornelli (d. 1718). In the 18th century France led the way in cartography by state survey resulting in the Carte Géométrique de la France. The British Ordnance Survey was begun in 1784.
In our own times excellent maps are produced by the million accessible to all classes, and are of great account for educational purposes. The most prominent names of recent cartographers are—German: Kiepert, Berghaus, Petermann, Hassenstein, Habenicht, Justus Perthes, &c.; Italian: Guido; Coro; British: Arrowsmith, Hughes (educational), Ravenstein, and the geographical firms of W. & A. K. Johnston, E. Stanford, and Bartholo- mew & Co. See also the articles CONTOUR LINES, DEGREE, EARTH, LATITUDE AND LONGITUDE, MERIDIAN, ORDNANCE SURVEY.