Spectrum. As explained under the article COLOUR, light emanating from any ordinary source is rarely if ever homogeneous. It is composed of rays of different wave-lengths, each of which if viewed singly would appear to have an appropriate colour. The general colour-sensation produced by such a heterogeneous ray can teach us very little concerning its composition. Not until we have formed its spectrum by appropriate means are we able to analyse it. A spectrum is in fact an image in which the component parts of a given ray of light are separated from one another so that each may be viewed singly.
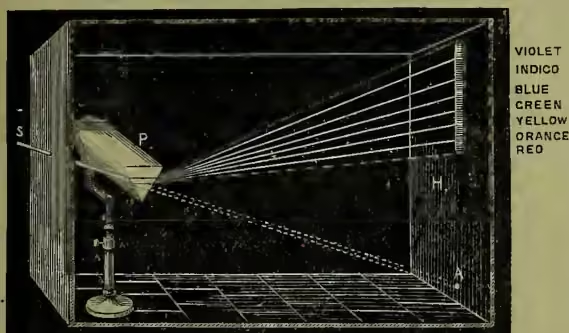
Newton was the first who scientifically produced and studied the spectrum of sunlight. This he did by interposing a glass prism in the path of a ray which was allowed to enter a dark room through a small hole in the shutter. The arrangement is shown diagrammatically in fig. 1. Here the rays are bent out of their original course, SA, as they pass through the prism P; and on the screen, H, the spectrum of colours is formed instead of the image A. Newton regarded the spectrum as being divisible into seven differently coloured spaces, which he called in order red, orange, yellow, green, blue, indigo, and violet. It is impossible, however, to settle precisely the exact boundary between any two of these fancied species of colour, which pass by insensible gradations one into another. As Newton clearly demonstrated, the spectrum is produced because the differently coloured constituents of sunlight have different refrangibilities, the red being refracted least of all and the violet greatest of all (see REFRACTION). If light of a particular refrangibility were absent or of less intensity than the other constituents gaps would appear in the spectrum. As a matter of fact such gaps do exist in the solar spectrum, and were first observed by Wollaston in 1802. In 1817 Fraunhofer, with much more perfect optical apparatus, measured the relative positions of a great number of these dark
TABLE OF SPECTRA
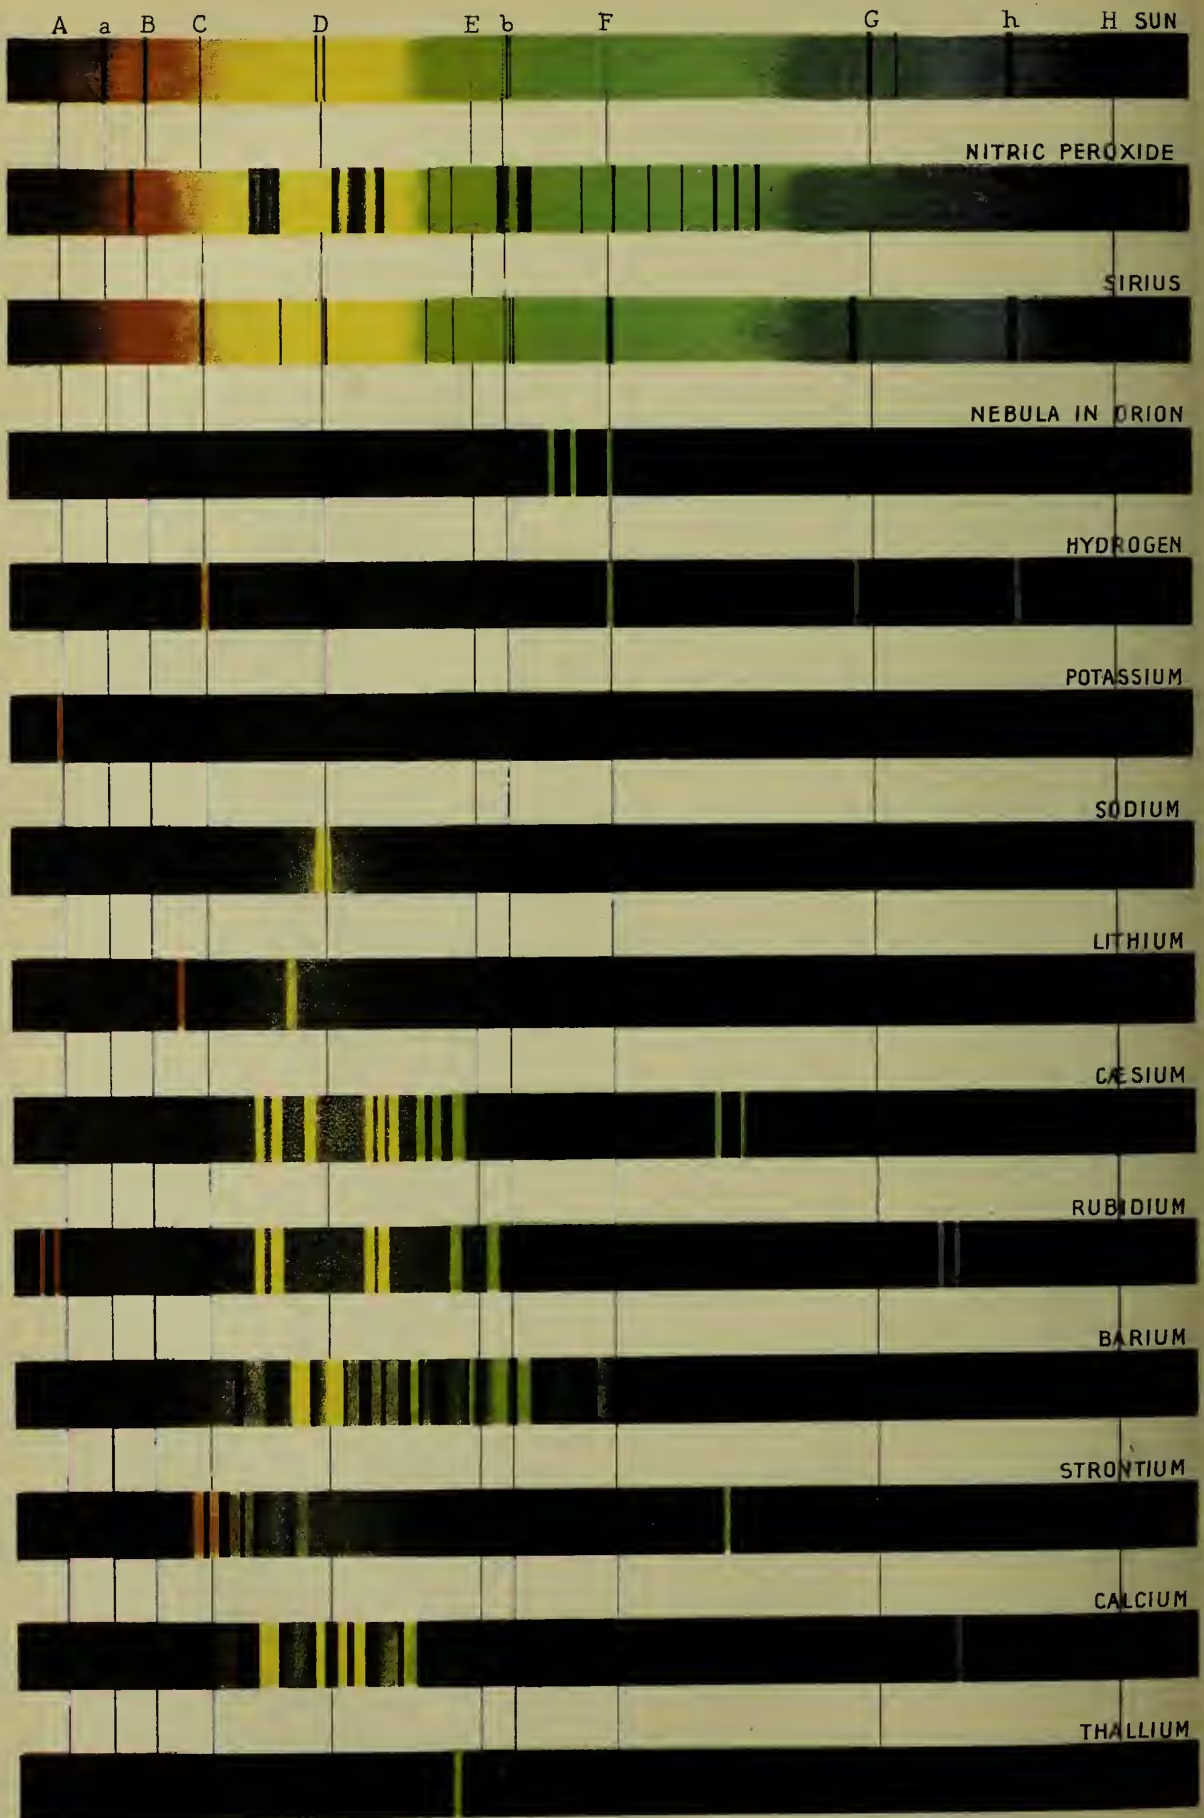
Showing the Character of the light obtained from various sources. lines, and named the more important of them by the early letters of the alphabet. These are shown in the first spectrum in the table of spectra. They are the standard lines with which it is usual to compare the line characteristics of other spectra.
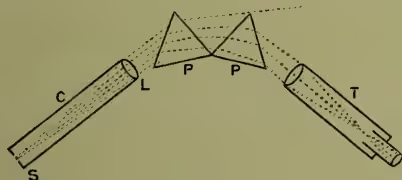
For the careful observation of these lines the spectroscope or spectrometer has been constructed. It consists essentially of a prism or train of prisms, P; a collimator, C, at the focus of whose lens, L, is placed a narrow slit, S, parallel to the edge of the prism; and a telescope, T, for producing a magnified image of the spectrum of the illuminated slit. Nearly all transparent refractory substances give similar spectra, although the dark lines may be somewhat differently spaced in the different cases. This arises from the fact that substances vary in their dispersive as well as in their refractive powers (see DISPERSION). The optical value of the spectroscope is that it gives us the means of accurately determining the refractive indices of different substances for rays of definite wave-lengths. Now, although refrangibility depends on wave-length, being in general greater for the shorter wave, it does not depend upon it according to any simple or common law. Hence in prismatic spectra the characteristic lines are not spaced in accordance with any simple relation to the wave-lengths of the corresponding rays. If, however, we substitute for the prismatic part of the spectroscope a diffraction-grating, we obtain a spectrum in which the rays are spaced according to a law of extreme simplicity.
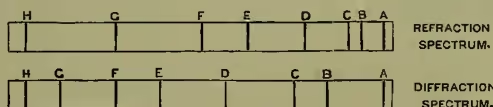
A diffraction-grating is formed by ruling a series of fine lines on a glass or metal surface. For the production of a good spectrum it is necessary that the lines should be equidistant and so close that several thousands go to an inch. If the image of an illuminated slit be viewed by a telescope through or after reflection from such a grating, a remarkable appearance is presented. A central luminous line is seen, just as if no grating existed, and for some distance on either side the field is dark. But soon on both sides spectra appear, with their blue ends nearest the central line. Still farther to left and right secondary spectra appear, their blue ends overlapping the red ends of the primary spectra. These are followed by a third but fainter set, and so on. These successive spectra are due to the Interference (q.v.) of the rays emanating from the discontinuous wave-front which has been made so discontinuous at the grating. The absolute position and breadth of the spectra depend on the closeness of the lines of the grating; but the relative positions of the coloured rays in any spectrum depend only on the wave-lengths. Thus in the solar spectrum produced by a diffraction-grating Fraunhofer's lines are so distributed that their distances from the central luminous line above mentioned are proportional to the wave-lengths of the corresponding rays of light. This spectrum is accordingly called the Normal Spectrum. Compared with it, the ordinary prismatic spectrum is much crushed towards the red end and extended towards the violet end. A rough comparison is shown in fig. 3, the principal Fraunhofer lines being given in the two spectra, which are of the same total length.
Professor Rowland, by means of his concave gratings, or gratings marked on a concave cylindrical surface of speculum metal, has produced remarkably fine spectra. Because of the slight concavity the grating focusses the spectrum clearly at a particular distance, so that the object-glass of the telescope may be dispensed with.
We have now to consider the significance of the dark lines in the solar spectrum. These gaps may be imagined as originating in two ways. They may be absent in the sunlight from the very beginning, or they may be absorbed by some substance through which the ray passes from the sun to the earth. As Brewster showed long ago, many of the lines are really due to absorption by the earth's atmosphere, and are more marked when the sun is low than when the sun is high. These lines which are certainly due to absorption by the earth's atmosphere are called telluric. Near the Fraunhofer D lines there exists a very remarkable group of lines known as the Rain-band. It is due to water-vapour in the air, and gets very dark as the humidity approaches saturation. The principal lines in the solar spectrum are, however, not telluric. Nor can they be explained as due to the absorptive action of the ether, inasmuch as the various spectra of stars, though broadly similar to that of the sun, differ from it and from one another greatly in detail. (Compare, for example, the spectra of Sirius and of the sun in the table.) In short, solar and stellar spectra are very characteristic in the number and distribution of the lines which cross what is otherwise a continuous spectrum (see STARS). If then these lines are due to absorption, it must be absorption in the atmosphere enveloping each star or sun. That this is the true explanation of the dark lines has been for long regarded as established beyond a doubt.
Previous, however, to the discovery of the principle which lies at the basis of stellar and solar spectroscopy, the great variety of spectra given by different substances had been recognised. Some of these are shown in the accompanying table of spectra; and, as suggested by Talbot and Herschel in 1825, an obvious application of the prism is to the qualitative determination of small quantities of substances in minerals. In the accompanying coloured plate, the characteristic spectra of the vapours of ten of the metals taken by themselves may be compared with the very different spectra of the sun, of nitric peroxide, and of Sirius; that of the nebula in Orion almost rivals in simplicity the visible spectrum of sodium vapour. The case of Thallium (q.v.) is of peculiar historic interest, since it was the observation of its very characteristic line spectrum which led to its discovery. Of even greater interest historically is the spectrum of sodium, which may be observed by burning common salt in a spirit-flame. Fraunhofer observed that the two bright yellow lines so characteristic of the sodium spectrum coincided in position with the double line known as D in the solar spectrum. A very careful test of this coincidence was made by Professor Miller, following upon which Stokes (in 1850) gave for the first time the physical explanation of the phenomenon—viz. that the Fraunhofer double D is produced by the absorptive action of sodium vapour in the sun's atmosphere. Foucault (in 1849) had already obtained an evident darkening of the D lines when the ray of sunlight was passed through the electric arc, which gave in its spectrum the bright sodium lines; but he failed to grasp the significance of the experiment. Ten years later Kirchhoff made a similar experiment, and to him we owe the complete statement of the principle on which spectrum-analysis is based. (For the important work of Balfour Stewart in this connection, see HEAT.) The principle is defined by Kirchhoff thus: the ratio of the emissive and absorptive powers for any given radiation is the same for all bodies at the same temperature. If we imagine the existence of an ideal black body which is at once a perfect absorber and a perfect radiator, we may, following Tait in his development of Stewart, express the principle in this wise: for any given temperature the emissivity of a radiating body is equal to its absorptivity. Here emissivity is the emissive power of the chosen body compared with that of the ideal black body; and similarly absorptivity is the ratio of the absorptive powers of the chosen body and the black body for the same radiation at the same temperature. Suppose we have a body A exposed to radiation from a body B. If A were black the whole radiation would be absorbed. As it is, however, the body A will absorb only , where is the emissivity. Again, if is the measure of the radiation which a black body at the temperature of A would radiate, will measure the radiation of A. Hence the amount of radiation which reaches us from A, and through A from B, will be . Hence there will be a real resultant absorption by A as the rays from B pass through it if, and only if, is greater than —i.e. in accordance with experience, if B is at a higher temperature than A. The ultimate basis of the argument is the Second Law of Thermodynamics (q.v.); and it should be noted that the principle fails to apply to cases of phosphorescence or fluorescence. Thus we conclude that the Fraunhofer lines in the solar spectrum are due to the absorptive action of the comparatively cool atmosphere of the sun upon the radiation which comes from the hotter interior parts. At the instant of a total eclipse of the sun, when the hot interior is screened off, the spectrum of the cooler but still self-luminous envelope is seen to consist of several bright lines. With the exception of one peculiar line in the yellow, these are all coincident in position with certain of the dark Fraunhofer lines. The most conspicuous of the lines that so become reversed are the four hydrogen lines. The line due to magnesium, the double D, and some of the iron lines have also been observed reversed at the instant of totality.
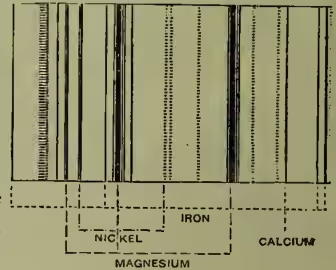
The identification of the dark lines in solar and stellar spectra with the bright lines in the spectra of the various elementary substances raised to a high enough temperature is one of the most important labours of the spectroscopist. A list of the elements which have been proved to exist in the solar atmosphere will be found in the article SUN. In fig. 4 a small portion of the sun's spectrum near the line is given, showing the identification of certain constituents of the sun's atmosphere with iron, magnesium, nickel, and calcium. example, although hydrogen, like all gases, gives at ordinary pressures a bright line spectrum with sharp thin lines, these lines become broader and broader as the pressure is increased, until at very high pressures the spectrum becomes almost continuous like that given by a glowing white hot solid. Thus we learn that a highly compressed gas at a high temperature ceases to give the discontinuous bright line spectrum so characteristic of it at low pressures. One tolerably safe conclusion to draw is that stars which all have continuous spectra crossed by dark absorption lines or bands consist of a highly condensed nucleus; whereas true nebulae, which show bright line spectra (see the table of spectra), are luminous because of the presence of glowing gas in a comparatively attenuated condition. In the case of Comets (q.v.) the spectrum is faintly continuous with bright lines crossing it—a mingling of solar reflected light with the proper gaseous spectrum of the comet itself. The planets give in like manner the spectrum of sunlight modified more or less by the absorptive character of their atmospheres.
If a ray of sunlight, or a ray from the electric or lime light, is passed through various liquids, very characteristic absorption bands are obtained across the otherwise continuous spectrum. For example, arterial and venous bloods give absorption spectra, which are readily distinguishable one from the other. The second spectrum in the plate is an absorption spectrum produced by passing the electric ray through peroxide of nitrogen. It shows the banded characteristics of such spectra.
A very remarkable application of spectrum-analysis is to the measurement of the rate of approach or recession of any heavenly body. If we are approaching a star the waves of light will meet us at a somewhat quicker rate than if we were relatively steady with regard to it. That is, the waves of light will appear to be shorter—hence all the lines in the spectrum will be displaced towards the violet end. On the other hand, if we are receding from the star, the spectrum lines will appear to be shifted towards the red end. For example, in the spectrum of Sirius, the F line is very slightly shifted towards the red by an amount which is measurable in a fine spectroscope. The interpretation is that Sirius is receding from the solar system with a velocity of about 20 miles per second. Arcturus, on the other hand, is approaching our system with a speed of 55 miles per second. Similar displacements of lines are observed in the spectra of certain sun-spots, which are thereby proved to consist of downrushes of gas.
Throughout this article we have confined our attention to the visible part of solar spectrum. But this extends much further than is apparent to the eye. Below the red are the dark heat rays, whose presence or absence can be demonstrated by the appropriate means. Professor Langley has specially studied this region with the aid of rock-salt prisms and the Bolometer (q.v.), and has carefully measured the positions of the absorption bands. Captain Abney has, by use of a special preparation of bromide of silver, obtained photographs of the infra-red end of the spectrum, and has identified some of the absorption lines with lines in the spectra of metals of low melting points, such as sodium and calcium. Metals which volatilise at high temperatures do not seem to give lines below the red. Above the visible violet again are the invisible actinic rays. This upper part of the spectrum can be made visible by allowing it to fall upon some suitable fluorescent substance, such as uranium glass or a solution of sulphate of quinine. Photography, however, supplies us with a perfect method for obtaining visible images of the actinic spectrum. Indeed, by properly choosing the sensitive substance, we can now photograph any part of the spectrum from a radiation of nearly four times the wave-length of the red rays up to the highest actinic rays known to exist; and in the extended solar spectrum so obtained we find the same characteristics throughout—a continuous spectrum crossed by dark lines.
Schellen's Spectralanalyse (2 vols. 3d ed. 1883; Eng. trans. 1885), with Atlas of spectra, is the most complete treatise on the subject. See also Lockyer's Studies in Spectrum Analysis (Inter. Sc. Series, 2d ed. 1886).