Graphic Statics. When forces simultaneously act on a particle which remains at rest they are in equilibrium, and, if there be three of them, lines drawn so as to represent the respective forces in magnitude and direction may be so arranged as together to form the well-known Triangle of Forces. Problems in which trigonometrical methods of finding the magnitude and direction of the third side of such a triangle (the resultant) are applied, when those of the other two (the components) are known, or of resolving any given force in any given direction into two 'components' in any two assigned directions, are of common occurrence in text-books. For practical purposes, however, it is very useful actually to draw to scale the triangle of forces appropriate to the data of any particular case; two sides being thus drawn to scale, the third side can be laid down by simply joining two points, and then the line so drawn can be measured with respect to its length and its direction. Similarly the resultant of a number of simultaneous forces can be usefully ascertained by drawing the corresponding Polygon of Forces, and ascertaining the lie and the length of the missing side. The utility of this graphic method is, however, most fully seen in the recent extensions of this method to engineering work. The subject of Graphic Statics is a large one, and we can do little more here than refer the reader to Cotterill's Applied Mechanics, which gives, incidentally, full references to the literature of the subject; but in order to give an idea of the nature of the method one illustration may here be supplied. Suppose a bridge-girder (weightless) made up of two
Fig. 1.
N girders in ten divisions (fig. 1), the diagonals being all so arranged as to be in tension; it is 100 feet long, and a load of 100 tons is distributed over it so as to rest uniformly upon the lower booms. Find the stress in each bar. First draw the girder to scale, and mark the bars as in fig. 2: The lower boom of each division may, so far as the
Fig. 2.
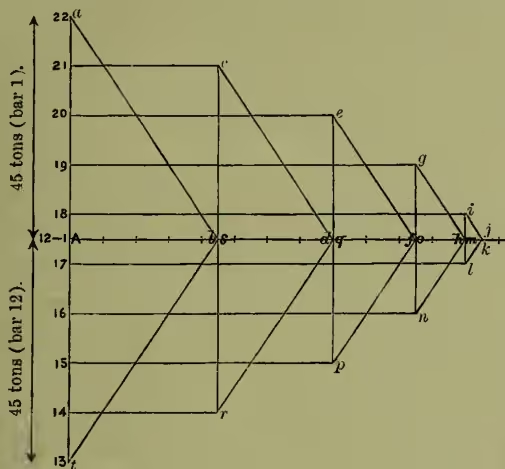
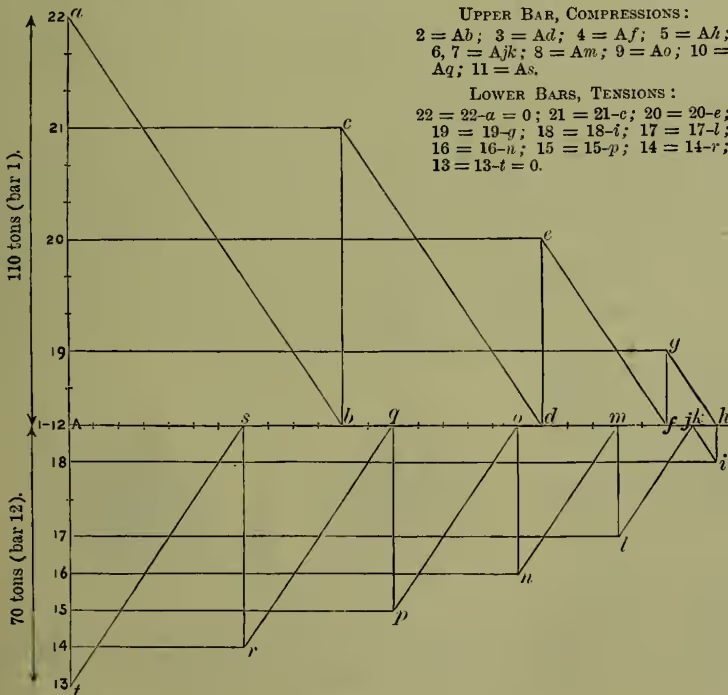
girder at large is concerned, be considered as having its proportion of the uniform load (10 tons) arranged in 5-ton loads at its two ends; hence at the angle between 1 and 22, and also at 12-13, there are imaginary loads of 5 tons; at bc, dc, fg, &c., imagine 10-ton loads. The supporting piers each exert an upward pressure of 50 tons. There is equilibrium, and this equilibrium may be traced out at every angle of the structure. At the angles 1-22 and 12-13 the upward pressure of the piers is partly neutralised by the local weight of 5 tons ; the vertical bars 1 and 12 have each an upward thrust of 45 tons, which carries the girder ; but at these angles there are no horizontal components along 22 and 13, which, therefore, have no thrust along them, and are neither compressed nor in tension. If a vertical line (fig. 3) be drawn, each division in which represents 10 tons, the distribution of load may be set out by taking a starting-point, A : then there is in the girder, from 1 round to 12, no load introduced ; between 12 and 13 there is introduced what is equivalent to an upward force of 45 tons in bar 12, and the representation of this is prepared for by setting off divisions downwards ; then between 13 and 14 there is a downward load of 10 tons, and the diagram sets off one division upwards, to 14 ; so for each of the junctions as far as 21-22, and then at 22-1 there is an upward 45 tons in bar 1, the setting-off for which brings us back to A. At the junction 1-2 we have three bars in equilibrium ; these are 1, 2, and ; the stress in 1 is 45 tons ; drawing a triangle, (fig. 3), in which the sides are parallel to 1, 2, and , we find the relative compressions in 1 and 2, and tension in . At the next junction, (fig. 2), we have four balanced forces, the tensions in 21 and , compression in , and a load of 10 tons. From the extremities of (fig. 3) draw 22-21 representing the 10-ton load acting downwards, and a line parallel to in fig. 2 ; join 21 and the line by a line parallel to the rod 21, the tension in which is now represented by the line 21-, while (fig. 3) represents the compression in (fig. 2). Next consider the junction 2-3 ; four bars, 2, , , and 3 ; 2 we know (, fig. 3), and also ; we draw a line , and a line parallel to 3 which, in order to complete the polygon, can only start from A ; and represent compression and tension in 3 and respectively. At the next junction, 21-20, we have 21 (), (), (unknown), 20 (nnknown), and a 10-ton load ; the polygon is completed by 20 and drawn from the ends of the broken line 21-20. Step by step, by mere drawing of intersecting lines, and by a process which, once the foundation has been laid by setting out the distribution of loads, is far more expeditious and simple than the explanation of it can at first enable it to appear, fig. 3, the measurable diagram of the girder-bar stresses, is evolved, and it is seen that as we near the centre the tensions on the diagonals diminish, that the vertical bar is neither under compression nor tension, and that the bars 6 and 7 are under the maximum compression (), and the bars 18 and 17 under the maximum tension (18-, 17-). It will be seen that the diagram is symmetrical ; but, if we take the case of a non-uniformly distributed load, the diagram becomes unsymmetrical. Suppose another 100 tons to be laid uniformly upon the lower booms of the left-hand half of the girder : now the piers respectively support 125 and 75 tons ; the stresses in bars 1 and 12 are 110 and 70 tons ; the diagram, built up on the same principles as in the preceding case, and drawn to a scale reduced to three-fourths, takes the form shown in fig. 4.
See R. H. Smith, Graphics ; or the Art of Calculation by Drawing Lines (1889).